Getting Started with Angular Performance Monitoring


Below are some results of some initial experimentation with Web Performance API and Angular.
I started out by adding a performance.mark('constructor') to a component constructor. To perform a measure you need at least two marks, so next add a performance.mark('OnInit') to ngOnInit.
Now that there are two marks you can do performance.measure('myNiftyMeasure', 'constructor', 'OnInit') right after the mark in your ngOnInit or in a later hook. With that you have created your first measure which you can view in the Chrome DevTools. Open DevTools, click on performance tab and click refresh symbol to 'Start profiling and reload page'. Once complete you can expand the Timings section and find your measure in the graph.
In the sample I've added measures for each lifecycle hook in Angular. So the measure is from the 'constructor' mark to an hook mark. This is just to illustrate usage and get an idea of how to work with these User Timings.
I've just logged measures to console as shown below.
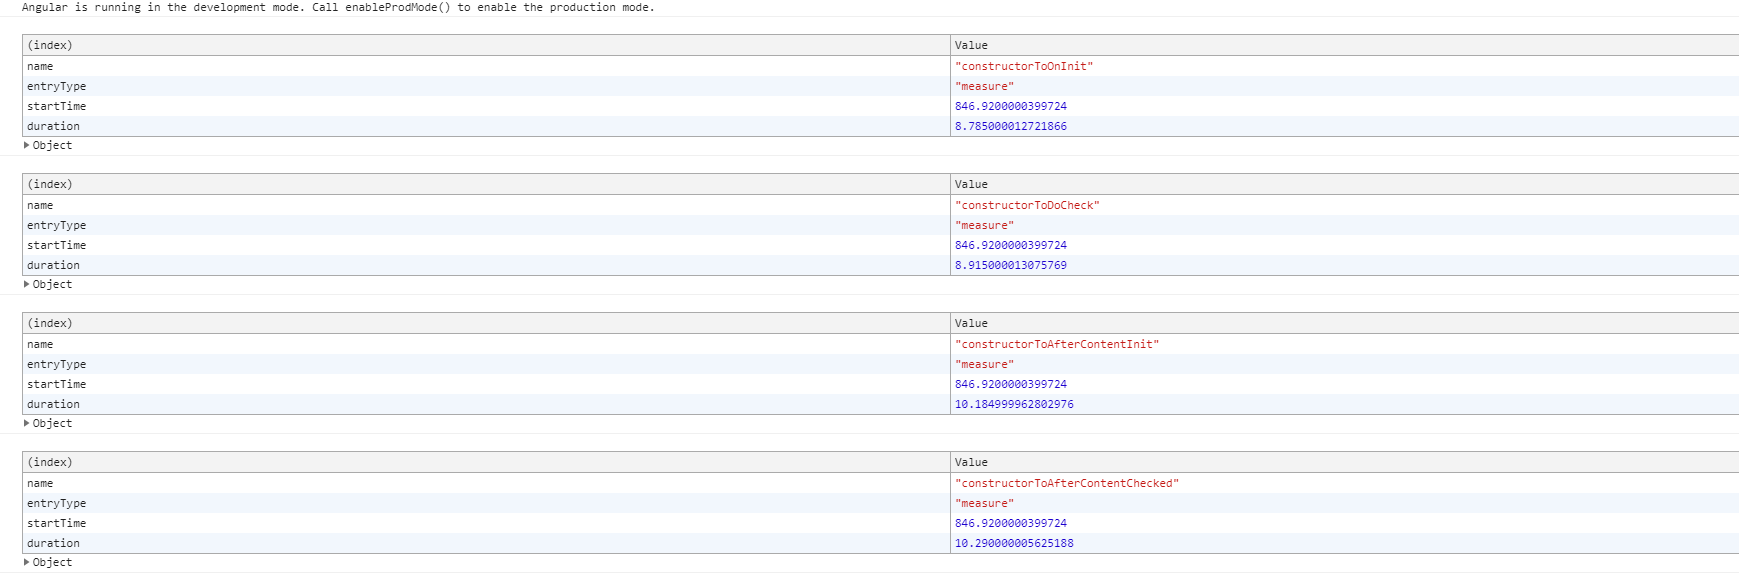
When doing this I came across some zonejs measures also, it's interesting to see how other libraries are using this API also.
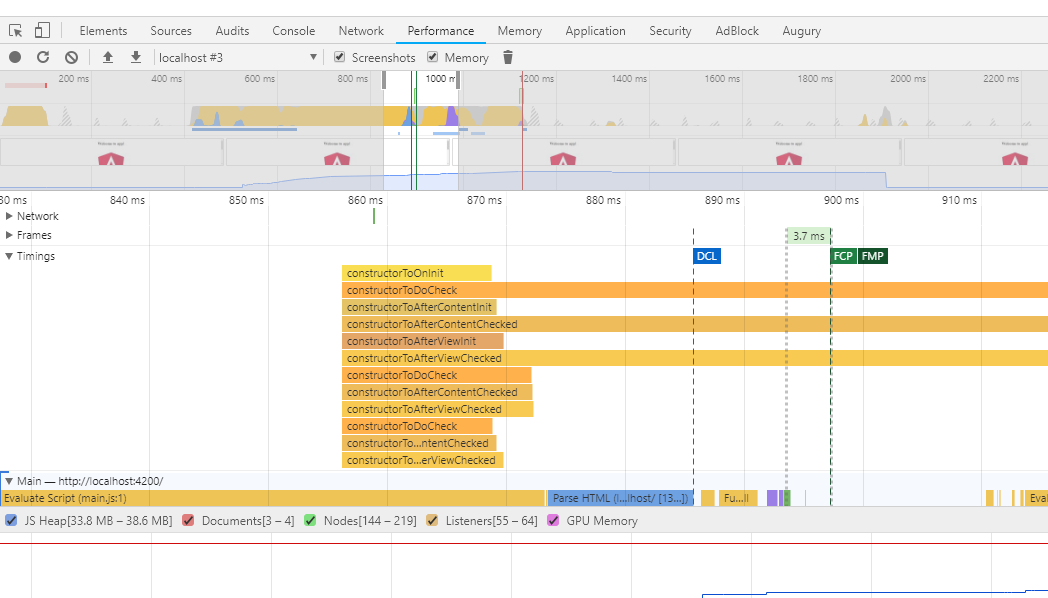
Below shows these measures in the performance tab
If you want to run this code check it out the repo here